
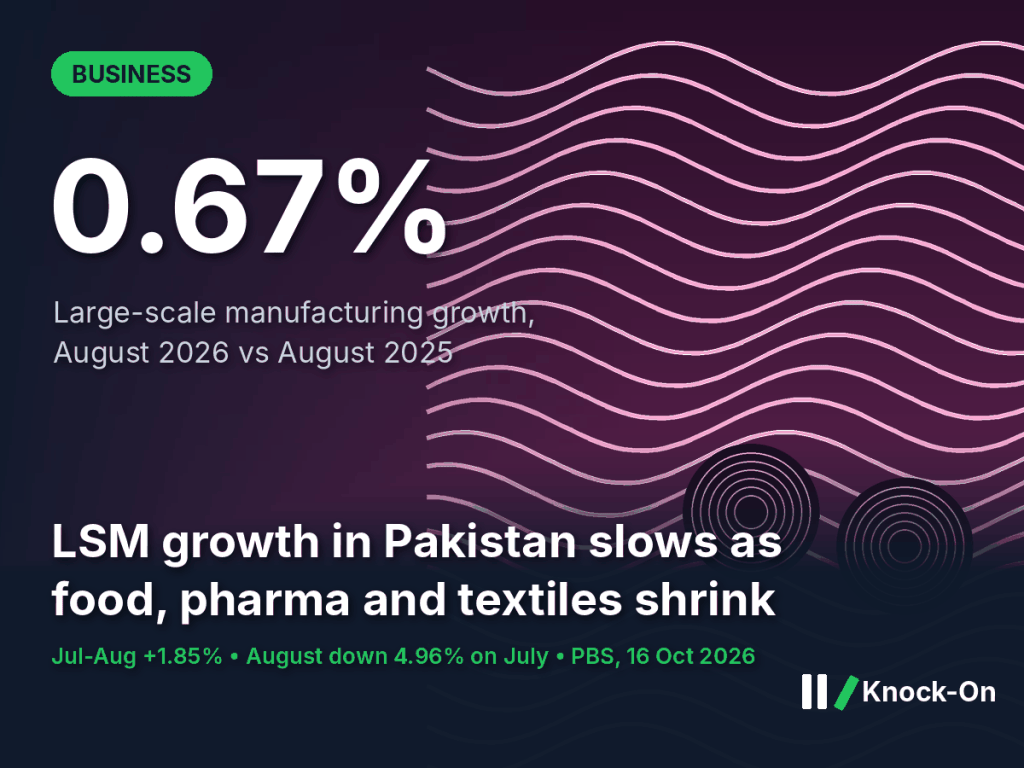
LSM growth in Pakistan slowed to just 0.67% year on year in August 2026, according to Pakistan Bureau of Statistics (PBS) data reported by Dawn. Large-scale manufacturing output also fell 4.96% from July, when it had rebounded by 3.03%. Over the first two months of the fiscal year, factory output was 1.85% higher than a year earlier, well below the 4.98% growth recorded in FY26. The headline hides a split: apparel, cars and petroleum products are growing fast, while food, pharmaceuticals, chemicals and textiles are shrinking.
The short version
- LSM grew 0.67% in August from a year earlier and fell 4.96% from July.
- July–August output was up 1.85%, against 4.98% growth in FY26.
- Wearing apparel added 2.85 percentage points to growth; food took away 1.20 points.
- Car and jeep output rose 30.45%, while pharmaceuticals fell 14.57% and iron and steel 11.48%.
What happened
The Quantum Index of Manufacturing stood at 113.19 in August 2026, up from 112.45 a year earlier, PBS data show. After a 3.48% contraction in June and a 3.03% rebound in July, August’s reading points to a recovery that has lost pace. Dawn’s analysis described July’s bounce as “fragile and concentrated in a relatively small group of industries.”
The detail shows where the growth is. In July–August, automobile output rose 32.45%, including a 77.70% jump in trucks, though light commercial vehicles fell 15.99%. Coke and petroleum products rose 15.48%, led by petrol (24.69%) and diesel (10.10%), while furnace oil fell 44.37%. On the other side, the food group shrank 8.86%, with cooking oil down 20.46% and vegetable ghee down 16.57%. Textiles fell 2.98%, fertiliser 7.55% and pharmaceuticals 14.57%.
Apparel alone added more to factory growth than food and chemicals together took away
Contribution to LSM growth, July–August FY27 vs a year earlier, percentage points
Why it matters
Large-scale manufacturing is the factory core of the economy, and slow LSM growth makes the government’s growth ambitions harder to reach. Finance Minister Muhammad Aurangzeb has spoken of growth above 4%, while lenders expect less. Narrow growth is also fragile: when three industries carry the index, a setback in any one of them can tip output into decline. The weakness in textiles, which Dawn called “particularly significant given the sector’s weight in Pakistan’s manufacturing and export base,” matters for exports at a time when imports are already growing faster, as the September current account deficit showed.
The knock-on effects
First order: winners and losers on the factory floor
Garment makers, assemblers and refiners are running harder, which supports their suppliers of trims, parts and crude. Edible oil, ghee, pharmaceutical and steel producers are making less, which means lower capacity use and higher fixed costs per unit.
Second order: jobs, credit and power demand
Slower factory output usually means less hiring, weaker demand for working-capital loans and softer industrial use of electricity and gas. Banks may stay cautious about lending to shrinking sectors such as steel and food processing.
Third order: earnings and policy
Listed companies in contracting sectors may report weaker volumes in their coming quarterly results. A broad slowdown in LSM growth in Pakistan could also add to pressure on policymakers to ease costs for industry, though high inflation limits room to cut interest rates.
Who could benefit
- Apparel exporters: the biggest single driver of growth, with garment exports up 16.69%, Dawn reports.
- Carmakers and parts suppliers: car and jeep output up 30.45%, consistent with the jump in Pakistan car sales last quarter.
- Refiners: petrol output up 24.69% and diesel 10.10%.
Who may face pressure
- Edible oil and ghee producers, with output down about a fifth and a sixth respectively.
- Pharmaceutical manufacturers, down 14.57%.
- Steel makers (down 11.48%) and fertiliser plants (down 7.55%).
- Spinning and weaving mills, as the wider textile group shrank 2.98%.
What to watch
- Mid-November: PBS’s September LSM figures, which will complete the first-quarter picture.
- Quarterly results: volumes reported by listed autos, pharma, steel and food companies for July–September.
- Gas supply: winter curbs on industrial gas could weigh on fertiliser and textile output.
- Energy costs: fuel and power prices, which feed into costs for every manufacturer.
Sources
- Dawn, Big industry output posts meagre rise, 17 Oct 2026 (Pakistan Bureau of Statistics data)
This is analysis, not investment advice. Figures are as of 17 Oct 2026.

Leave a Reply