
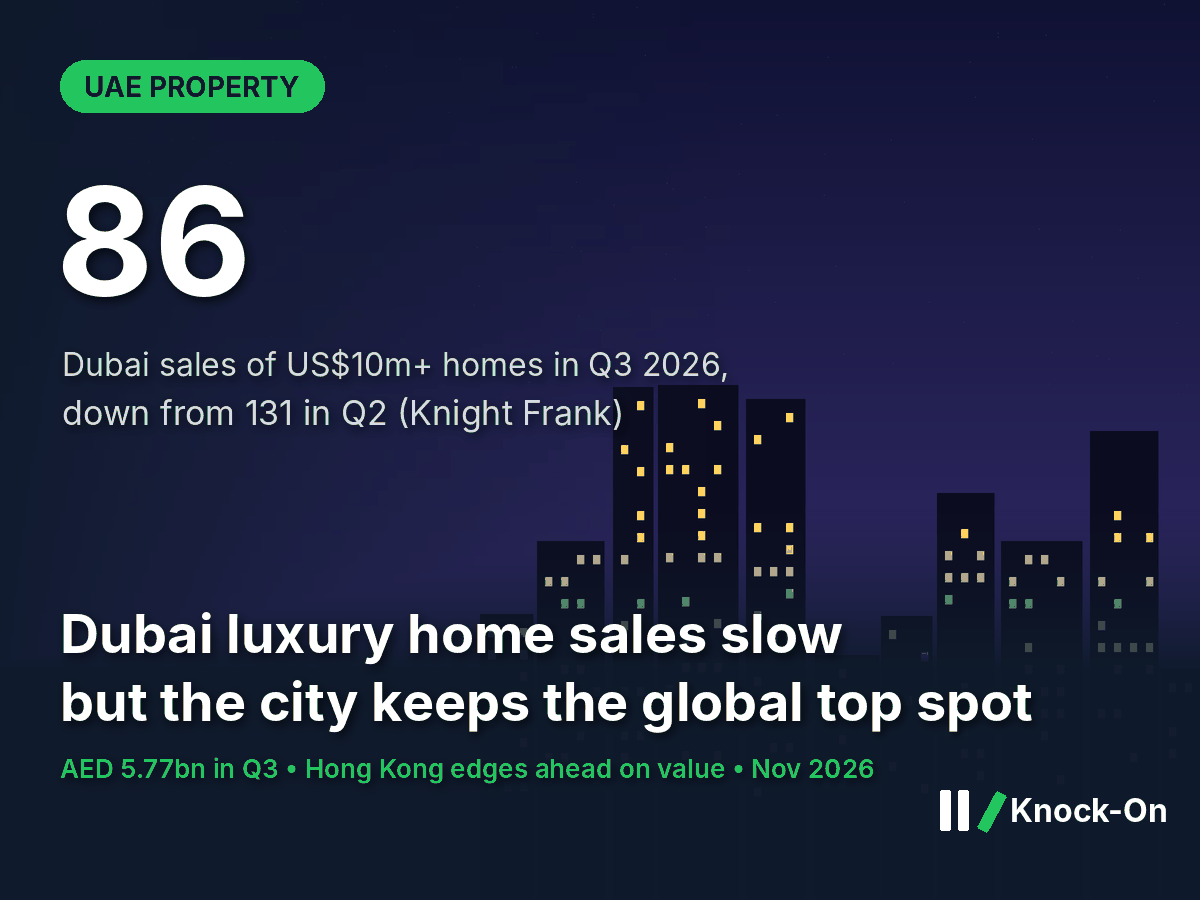
Dubai luxury home sales slowed sharply in the third quarter of 2026, but the city kept its place as the world’s busiest market for homes worth US$10m (about AED 36.7m) or more. Knight Frank’s global super-prime report, reported by The National, counts 86 such sales in Dubai between July and September, worth US$1.57bn (AED 5.77bn). That is down 34% by number and 28% by value on the second quarter. For developers, brokers and the businesses that serve wealthy buyers, the top of the market is thinner, but each deal is bigger.
The short version
- Dubai recorded 86 super-prime home sales worth AED 5.77bn in Q3 2026, down from 131 worth AED 7.97bn in Q2.
- Dubai still ranks first by number of deals; Hong Kong (78 sales, AED 5.80bn) edged past it on value.
- The average Dubai super-prime deal rose to about AED 67.0m from AED 60.8m (Knock-On calculation).
- Over 12 months, Dubai logged 525 deals worth AED 33.97bn, still well ahead of every other city.
What happened
Knight Frank tracks sales of homes priced at US$10m or more across 12 major cities. In the third quarter Dubai’s count fell to 86 from 131 in the second quarter, the second quarterly decline in a row. Value fell to US$1.57bn from US$2.17bn, according to Knight Frank’s Q2 review and the Q3 figures reported by The National. Hong Kong recorded 78 sales worth US$1.58bn, passing Dubai on value for the first time since 2022. New York had 62 sales, Sydney a record 57, Singapore 44 and London 42.
Dubai still leads on super-prime deal count
Sales of homes worth US$10m or more, Q3 2026, number of deals and value in AED
Why it matters
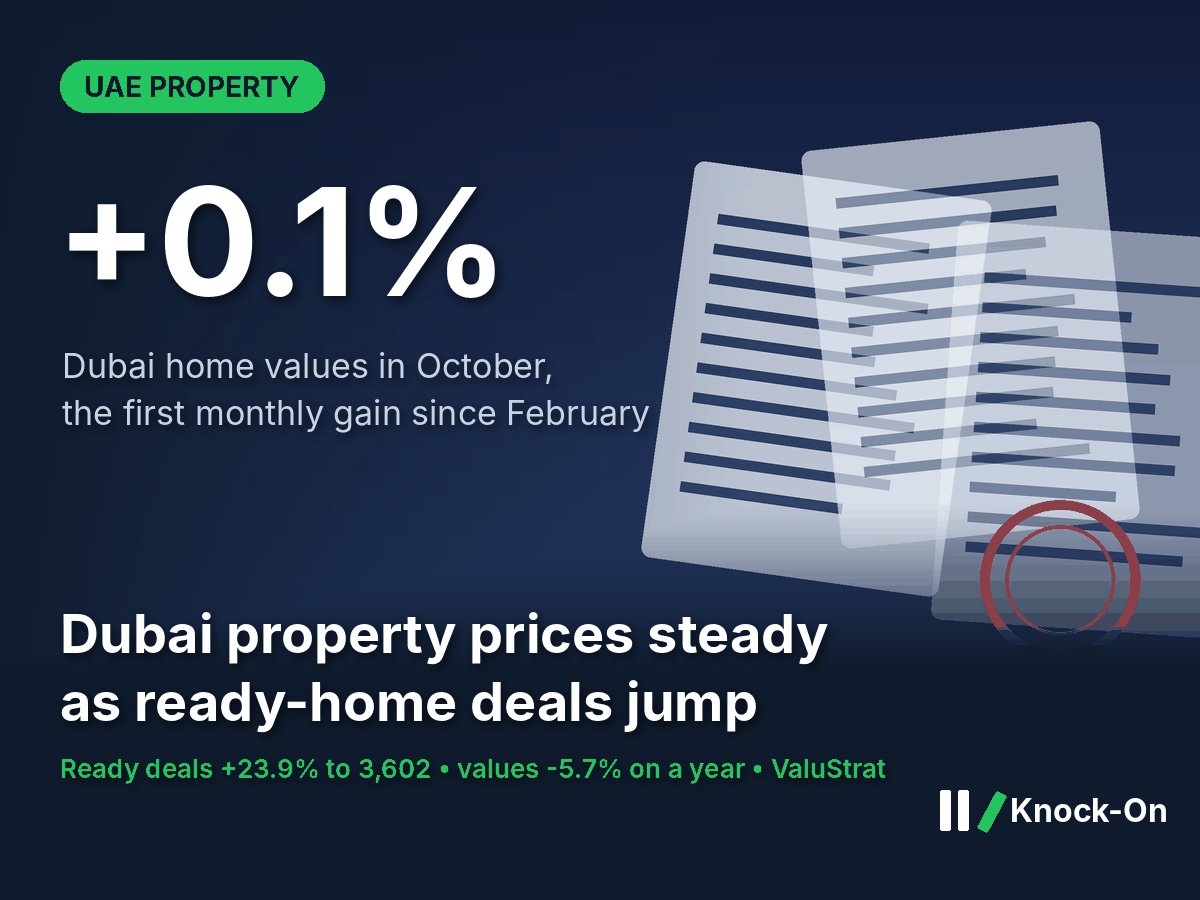
Super-prime deals are few, but they carry weight. They set price benchmarks for prime areas, attract international attention to Dubai and support high-margin sales for developers. A 34% drop in deals in one quarter suggests some wealthy buyers are waiting. Yet the average price rose by about 10%, so those still buying are paying more per home. That fits the wider Dubai picture: Dubai property prices edged up 0.1% in October, with buyers favouring finished homes, and Emaar’s results show homebuilding still carrying the group.
The knock-on effects
First order: fewer, bigger commissions
Luxury brokerages and conveyancers see fewer transactions, but higher average values soften the hit to fee income per deal.
Second order: developers pace luxury launches
Developers with branded or ultra-prime projects may phase launches more carefully while demand is slower, which affects contractors, fit-out firms and interior suppliers working on high-end schemes.
Third order: competition for global wealth
Hong Kong overtaking Dubai on value and Sydney’s record quarter show that internationally mobile buyers have choices. Dubai’s private banks, wealth managers and relocation services compete in the same market.
Who could benefit
- Owners of finished prime homes: buyers paying more per deal favour stock they can see and move into.
- Buyers with cash: a slower top end can give more room to negotiate.
- Interior, furnishing and property-management firms: larger homes mean larger contracts.
Who may face pressure
- Luxury brokerages: deal volume fell by a third in a quarter.
- Developers of ultra-prime off-plan projects: fewer buyers at the very top.
- High-end retail and hospitality: fewer new wealthy arrivals can mean slower spending.
What to watch
- Early January 2027: Dubai Land Department full-year 2026 transaction data.
- February 2027: Knight Frank’s Q4 super-prime figures, to see if Dubai holds first place.
- Monthly: prime-area price indices for signs that the higher average deal size holds.
Sources
- The National, Dubai’s super-prime property sales cling on to global top spot, 13 November 2026
- Knight Frank, Risers and fallers in the global super-prime reordering, 16 September 2026
This is analysis, not investment advice. Figures are as of 15 November 2026.

Leave a Reply